BEST CODE TO GET STATISTICS FOR AN ARRAY OR A LIST . . .

2023-01-16-155334
All --
I am working on an APP that has a bunch of different ARRAYS of MEASUREMENTS from a bunch of different IMAGES.
The APP needs to be able to CALCULATE and DISPLAY the STATISTICS for each of the ARRAYS.
In a DISCUSSION in MAY-2015, I was directed to
ThisApplication.GlobalTools.McBasicStatistics
and that works but at some point I was able to use LISTS and CODE for VB.NET that gets the STATISTICS with something like
This was discussed in a DISCUSSION in MAR-2021 but I cannot seem to get the LISTS to show the STATISTICAL TOOLS like I seemed to be able to when I did this
***
After declaring a LIST in IP10 with something like this
Dim Prog_ListLengths1 As New System.Collections.Generic.List(Of Double)
and then adding my Lengths to the LIST with something like this
                                    'REMEMBER THE LENGTH OF THIS FEATURE
                                    Prog_ListLengths1.add _
                                        ( _
                                        sf.Value(eMeasures.RgnLength) _
                                        )
Then I can get the STATS from the LIST with something like this
                Debug.Print Prog_ListLengths1.Min
                Debug.Print Prog_ListLengths1.Max
                Debug.Print Prog_ListLengths1.Average
***
I have created and attached a DEMONSTRATION PROJECT in
Array Statistics Project V1A.ipx
that has a DEMO ARRAY, a DEMO LIST, and a determination of a STANDARD DEVIATION using
        Dim MyStats As mediacy.IQL.ObjectManager.BASIC_STATISTICS = _
            ThisApplication.GlobalTools.McBasicStatistics(MyDemoArray)

        textBox3.Text = _
            "The STANDARD DEVIATION for MyDemoArray is " & Format (MyStats.StdDev,"#,##0.00")
Is there a better way to get the STATISTICS for the DEMO ARRAY or the DEMO LIST?
Thanks.
-- Matt
0
Best Answers
-
Hi Matt,
System.Linq with .NET IEnumerable interface provides functions for simple statistics, such as Min, Max, Sum, Average. Check this link: https://learn.microsoft.com/en-us/dotnet/api/system.linq.enumerable?view=netframework-4.8
If you need Standard Deviation for any array, then you have to use something else, such as McBasicStatistics.
If you are trying to get statistics of Measurements, then you can use Statistics property of McMMData: https://help.mediacy.com/Image-Pro/Automation/11/html/Properties_T_MediaCy_Addins_Measurements_StatsClass.htm
Here is an example that prints standard deviation of Area of the objects in active image:Public Sub MeasurementStats() Dim md As Mediacy.Addins.Measurements.McMMData=ThisApplication.ActiveImage.MeasurementsData Debug.Print ($"Standard deviation of Area = {md.Statistics(MediaCy.Addins.Measurements.eMeasures.RgnArea).StdDev}") End Sub
Yuri
0 -
Hi Matt,
As you pointed out, there are different ways to calculate Standard Deviation. Wikipedia page shows 3 equations (uncorrected, corrected, unbiased) : https://en.wikipedia.org/wiki/Standard_deviation
Image-Pro uses the "uncorrected" formula with N in denominator (also called standard deviation of entire population). Excel also has this function, it's called STDEVPA. The difference between STDEVA and STDEVPA is very small for large number of objects.
If you need a specific version, you can use the conversion formula as in your sample.
Yuri0

Answers
-
Yuri —
Thanks for that info.These arrays are filled with one measurement per image and grouped by sample preparation group.I think MCBASICSTATISTICS is the way to go.Having the STATISTICS available for MEASUREMENTS from a COUNT in the manner you reviewed is very help and I have used it previously.I thought that there was a way to declare a LIST in a manner that extensions like .STDDEV retuned STATISTICS for the LIST.
Thanks again.— Matt0 -
2023-01-17-180909Yuri --I have usedMCBASICSTATISTICSto calculate the STATISTICS for an ARRAY.I have passed those STATISTICS back to the DIALOG BOX using this code
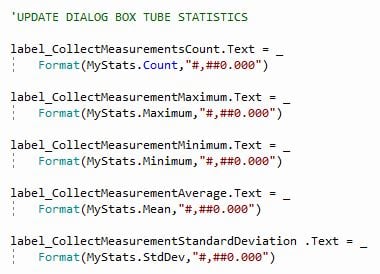 The values in the ARRAY and shown in the LABELS is shown here
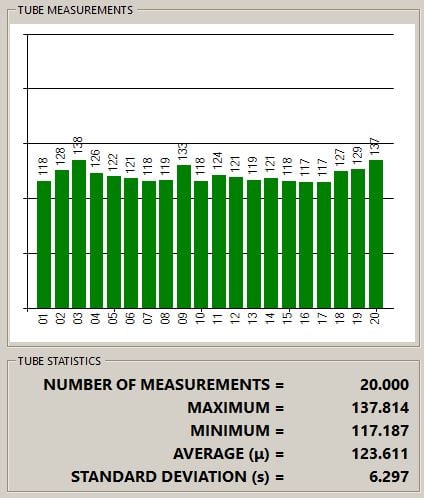 When I transfer the VALUES in the ARRAY to EXCEL and calculate the STATISTICS, the results are shown here.
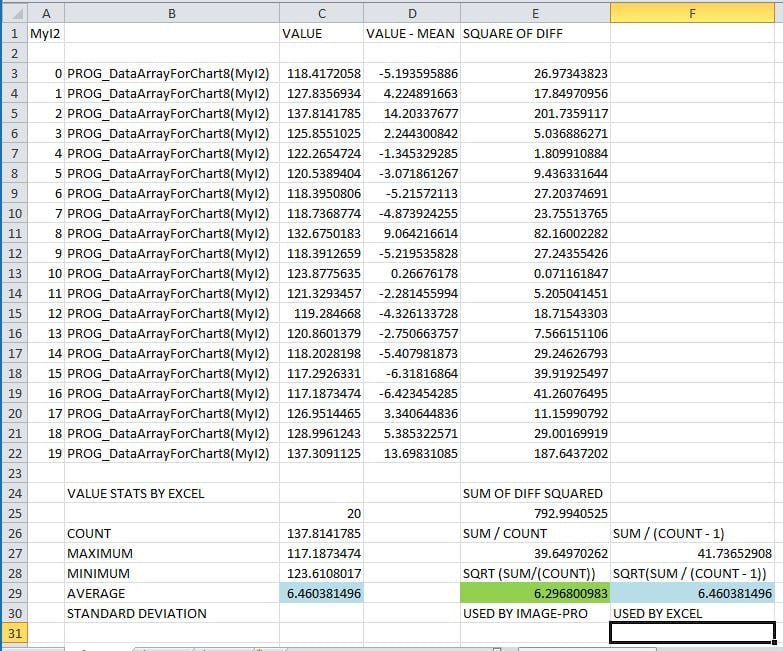 The STANDARD DEV calculated by IMAGE-PRO is 6.29. The STANDARD DEVIATION calculated by EXCEL is 6.46.The difference seems to be whether the STANDARD DEVIATION is calculated using the denominator or N or N - 1.EXCEL seems to use the N - 1 method labeled POPULATION in the image below.IMAGE-PRO seems to use the N method labeled SAMPLE in the image below.
 Most references that I see use the use the N - 1 method.I can get the same value as the N method by using the IMAGE-PRO STATISTICSlabel_CollectMeasurementStandardDeviation .Text = _
Format(System.Math.Sqrt((MyStats.Variance)*(MyStats.Count)/(MyStats.Count-1)),"#,##0.000")Is there is a reason that IMAGE-PRO varies from EXCEL on this?Thanks.-- Matt
0
Categories
- All Categories
- 958 Image-Pro v9 and higher
- 9 Image-Pro FAQs
- 18 Image-Pro Download & Install
- 444 Image-Pro General Discussions
- 487 Image-Pro Automation (Macros, Apps, Reports)
- 20 AutoQuant Deconvolution
- 2 AutoQuant Download & Install
- 18 AutoQuant General Discussions
- 193 Image-Pro Plus v7 and lower
- 3 Image-Pro Plus Download & Install
- 105 Image-Pro Plus General Discussions
- 85 Image-Pro Plus Automation with Macros
- 35 Legacy Products
- 15 Image-Pro Premier 3D General Discussions
- 20 Image-Pro Insight General Discussions