Orientation plot limits
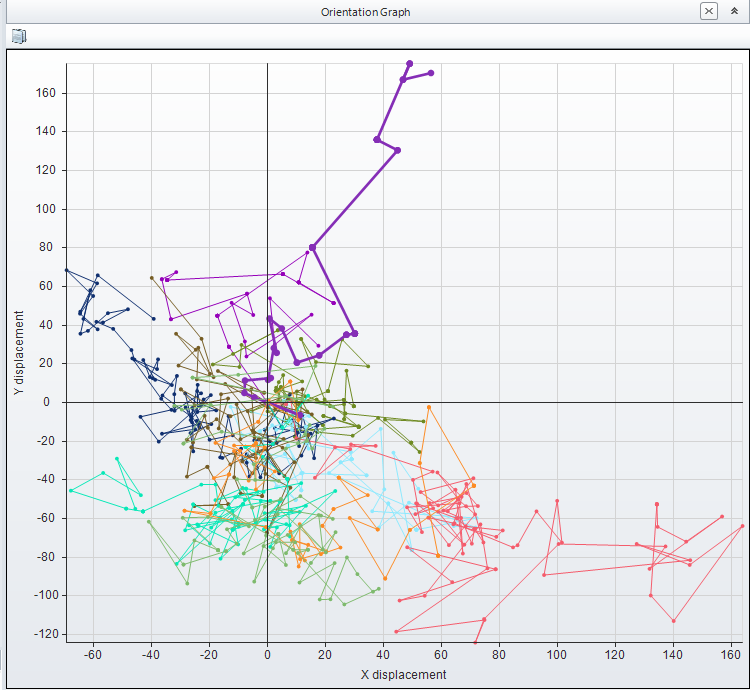
Hi again! Is it possible to adjust the minimum and maximum axis values for the Orientation plot created by motion tracking? We would like to be able to compare results between samples, but keep the same relative X and Y coordinates between samples (to demonstrate that one set of cells is moving far more slowly than another set, and so the tracks are much closer to the origin).
It would be nice if we could force the below to go from -200 to 200 on both axes.

It would be nice if we could force the below to go from -200 to 200 on both axes.

0
Best Answer
-
The orientation plot is auto-scaled to the extends of the existing tracks, so it's not possible to define the axis ranges.
As a workaround, you can add a track that would define the max extends of the displacement.
Here is the macro that will add a new "Ref" track to auto-scale the orientation plot to -200...200 range for X and Y axes:Public Function AddMaxTrack() As SimpleScript AddMaxTrack = New SimpleScript Dim trdoc1, obj1 'define the range of the max displacement Dim r As Double=200 With Application.DocumentCommands.Active(AddMaxTrack) .Run(trdoc1) End With With Measure.TrackingCommands.AddManualTrack(AddMaxTrack) .Points = New System.Collections.Generic.List(Of System.Drawing.PointF) .Points.Add(New System.Drawing.PointF(0,0)) .Points.Add(New System.Drawing.PointF(-r,0)) .Points.Add(New System.Drawing.PointF(-r,-r)) .Points.Add(New System.Drawing.PointF(r,-r)) .Points.Add(New System.Drawing.PointF(r,r)) .Points.Add(New System.Drawing.PointF(-r,r)) .StartFrame = 0 .TrackName = "Ref" .Run(trdoc1, obj1) End With End Function
Yuri0
Answers
-
Thanks, clever solution. I will give that a try.0
-
Ah, so that worked 99%, but for presentation purposes, there is now a random color around the border of each plot. Is there a command make sure the newly created track is Black or White? I cannot seem to find any sort of color or transparency options per track.0
-
Oh, never mind, you can change the color through the data table!0
-
Yes, it's possible to set track color. Here is the modified macro that adds White reference track:
    Public Function AddMaxTrack() As SimpleScript
        AddMaxTrack = New SimpleScript
        Dim trdoc1, obj1
        'define the range of the max displacement
        Dim r As Double=200

        With Application.DocumentCommands.Active(AddMaxTrack)
            .Run(trdoc1)
        End With

        With Measure.TrackingCommands.AddManualTrack(AddMaxTrack)
            .Points = New System.Collections.Generic.List(Of System.Drawing.PointF)
            .Points.Add(New System.Drawing.PointF(0,0))
            .Points.Add(New System.Drawing.PointF(-r,0))
            .Points.Add(New System.Drawing.PointF(-r,-r))
            .Points.Add(New System.Drawing.PointF(r,-r))
            .Points.Add(New System.Drawing.PointF(r,r))
            .Points.Add(New System.Drawing.PointF(-r,r))
            .StartFrame = 0
            .TrackName = "Ref"
            .Run(trdoc1, obj1)
        End With

        With Automate.ScriptingCommands.CodeCommand(AddMaxTrack)
            If .Run() Then
                'set track color
                obj1.Color=System.Drawing.Color.White
            End If
        End With


    End Function
Yuri0
Categories
- All Categories
- 966 Image-Pro v9 and higher
- 9 Image-Pro FAQs
- 18 Image-Pro Download & Install
- 452 Image-Pro General Discussions
- 487 Image-Pro Automation (Macros, Apps, Reports)
- 20 AutoQuant Deconvolution
- 2 AutoQuant Download & Install
- 18 AutoQuant General Discussions
- 195 Image-Pro Plus v7 and lower
- 3 Image-Pro Plus Download & Install
- 106 Image-Pro Plus General Discussions
- 86 Image-Pro Plus Automation with Macros
- 19 Legacy Products
- 16 Image-Pro Premier 3D General Discussions
- 26 Image-Pro Insight General Discussions
